Statistics are in the dirt, and there is no one to analyze. You could write that ;) Yes, it's true, we live in the world of Big Data, we have a lot of data to choose from. Some people are overwhelmed by it and don't look at the statistics of their activities at all. Others go in the opposite direction - they are so immersed in statistics that they don't see the world outside of them. That's why today I'm writing about how to approach statistics in Meta Business Suite in a healthy way and how to read them.
If we are active on Facebook regularly and want to build a community around the brand (and we usually do), we need to make friends with statistics. Don't worry, these are not statistics for which we will have to take a separate elective. I will show you which data I look at in my work, depending on the goals set for a given client.
WHERE TO FIND FANPAGE STATISTICS
Statistics can be found in Meta Business Suite. This is a relatively new place, to which Facebook has added and continues to add a lot of tabs. You will find there not only statistics, but also the option to schedule and publish posts, manage your inbox and notifications. It is becoming a kind of center for managing the Meta world and, whether someone likes it or not, we have to befriend it.
"OVERVIEW" TAB
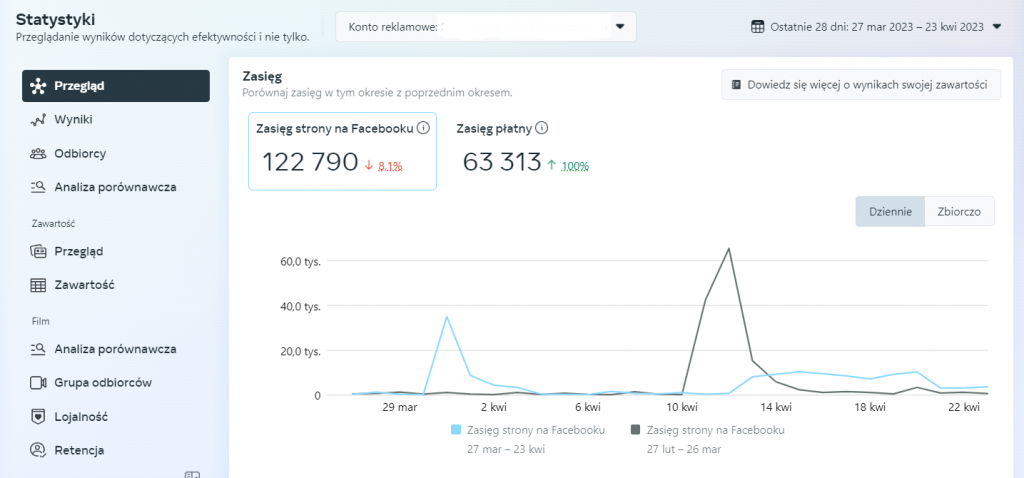
After entering the statistics tab (click) you will see an Overview of the most important data. In turn, from the menu on the left you can look for more in-depth information.
This isn't the most important tab for me, but I check it regularly to get an overview of what's been happening on the fanpage in recent days. For one client, regular fan growth is important, for another I look more at whether someone has visited the page. Here we need to ask ourselves about the KPIs (Key Performance Indicators) that are most important to you.
So let us stop here for a moment and answer the following questions:
- What business goal(s) do we have for running a Facebook fanpage? Let's write down these goals. Is it to build an active community? Sell products? Do we want to create a space for exchanging ideas? Do we want to have as many clicks to the blog as possible? Depending on the goal we choose, we will measure different data.
- Which statistics will show us whether the business goals selected in point one are (not) being met? Will it be the increase in fans? Maybe we care most about the number of video views, comments, shares, link clicks? Let's choose the data that we will measure weekly, monthly, quarterly and annually. Let's create a document in which we will collect it (hint: Excel works well for this). In the period we choose, let's write down the data and analyze it.
"RESULTS" TAB
Here we can choose the date range that interests us the most and check how the growth looks like, among others, total reach, profile visits or followers. We can also see how many people have unfollowed the account on Instagram or Facebook.
This tab is great for quick analysis of our activities. For example, if we started running live shows, let's check whether the number of fans increased or decreased on the day the live show took place (or maybe the live show didn't make a difference at all?). If it turns out that the graph is growing thanks to the live shows, then it's definitely worth continuing them.

"CONTENT" TAB and "CONTENT OVERVIEW"
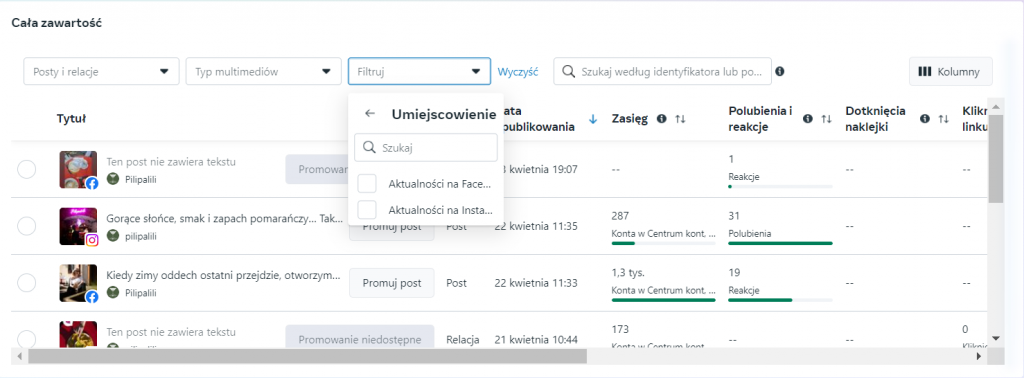
A very important place! Here we can see all the posts published so far.
Many people stop at this point at analyzing the reach alone, when the number of comments, reactions and shares are equally important.
Pay attention to important filters:
- posts, reports,
- multimedia type: photos, videos, text, links,
- marketing channel: organic, paid,
- location: Facebook and Instagram.
In turn, in the "Overview" tab (but in the "Content" section), we can check which content is performing best. For example, is it video content? Or maybe it's about a specific topic covered in the post, and here the format doesn't matter? Maybe photos of employees are performing best? Or maybe educational infographics? I encourage you to constantly analyze this data.
"RECIPIENTS" TAB
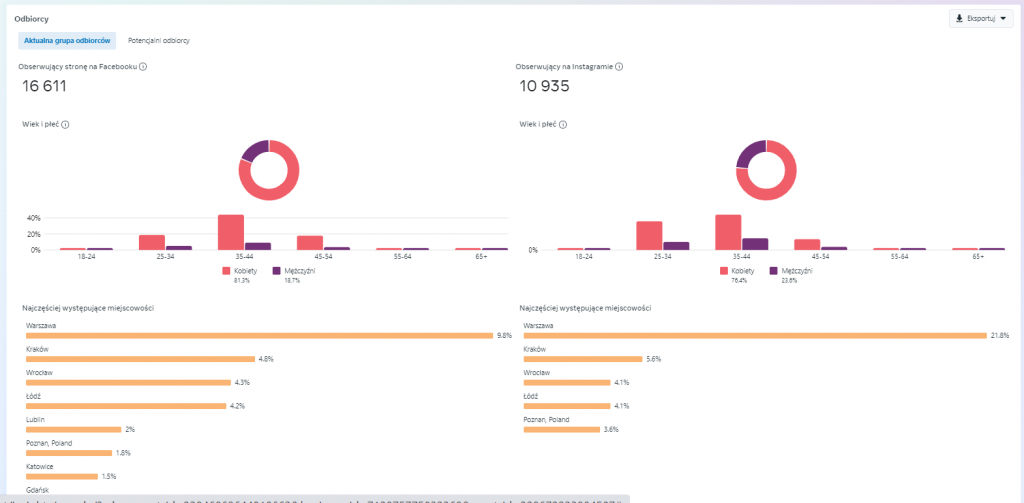
You don't have to check the Audience tab often - once a quarter is enough. Unless the activities on your accounts are heavily fueled by advertising budgets, then the data from this tab may change more quickly.
DATA EXPORT
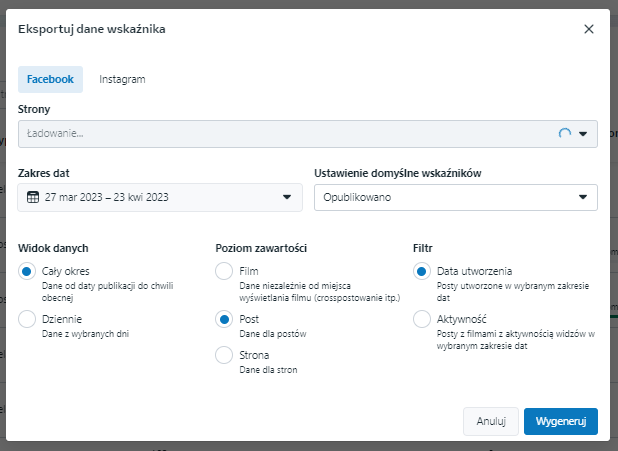
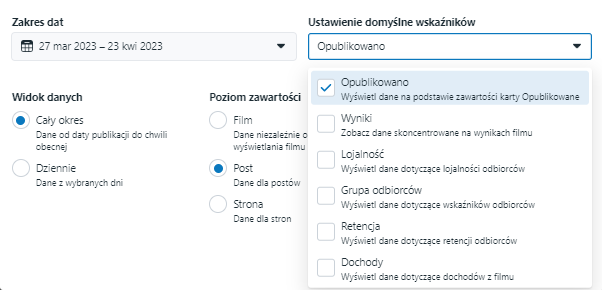
If we go back to the “Content” tab, in the upper right corner there is an “Export data” button, from which we can download data in Excel from the page, videos or posts for the period we are interested in. There is also an option to download data from an Instagram account.
—
In my experience, it is better to regularly check 2-3 most important data for us. Only in the case of larger summaries or problems can we delve deeper into statistics. However, those shown above in this article are more than enough to know if our activities on Facebook and Instagram are going in the right direction
SUMMARY
And that's it for the beginning of your adventure with statistics. I hope that from now on your measurements will make sense!
Not enough for you? Catch other articles:
- Facebook Company Manager – First Steps
- What are marketing funnels and how can they help you get to the next level?
- Make Your Ad Great: An Introduction to Facebook Ads Manager. Part 1
- The Basics of Color and Visual Communication Design
- How to make quality leads flow to us. Or about campaigns with the goal of "Gaining contacts" on Facebook
- Written by: Ola Dzwierzyńska
- Posted on: 24 Apr 2023
- Tags: facebook


